Hi neighbor,
Today I will be sharing with you our perspective on the local real estate market here in Cypress, Texas, specifically a market update for the neighborhood of Bridgeland. Whether you are looking to buy, sell, or just keep an eye on the market, we look forward to being your resource.
What is happening in the real estate market in Bridgeland?
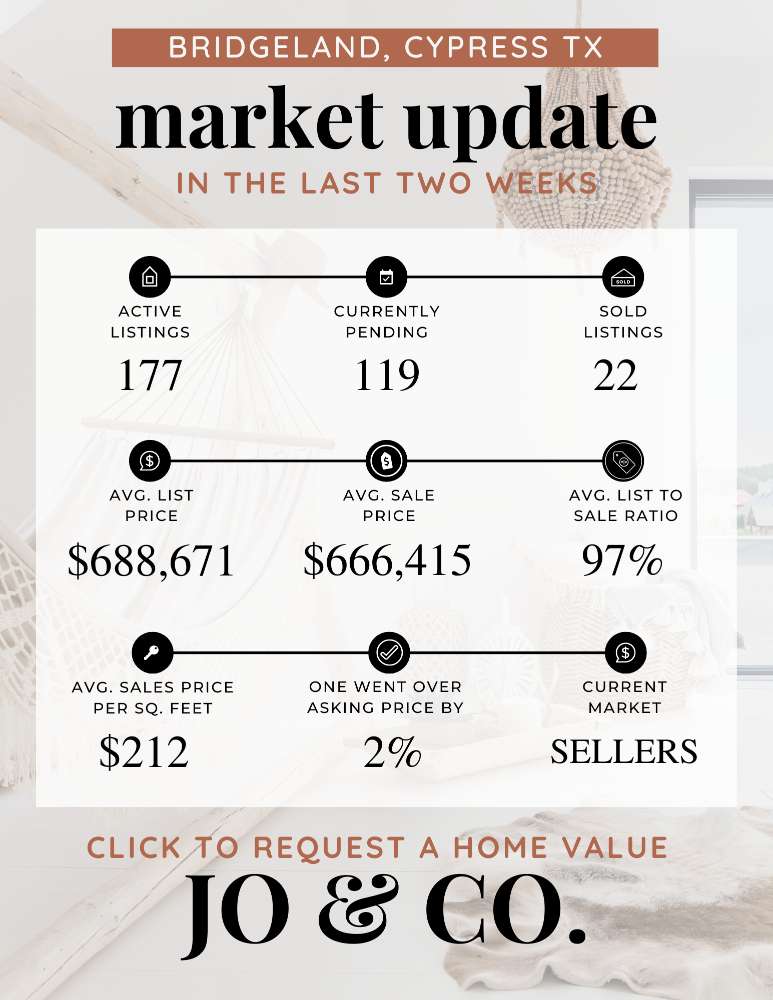
We currently have 119 homes pending, with 22 homes sold in the last two weeks, averaging a sale price of $212 a square foot. Twenty-two homes sold over the asking price, with one home selling 2% above the listing price.
Compared to the two weeks prior: Homes sold are up from 16 homes sold to 22 homes sold and the average sales price is also up: $666,415 ($591,108 previously). Every home is different, with different features, so don’t forget to ask us for your annual equity review if you are curious about your personal home. You can text AER to 79564 or email us here.
If we look at how fast the move-in ready homes are going, the demand in this area has not surpassed the supply, making it still a great time to sell. Buyer agents around Houston are seeing a slow in the real estate market, but it isn’t affecting every neighborhood. I know the interest rates rising has been one deterrent from some buyers purchasing right now, but that isn’t your ideal buyer anyways!
The most desirable homes in the area are still selling the first weekend or first week they hit the market (a really good coming soon campaign, like we do at Jo & Co. allows you to sell faster, for more money).
Check out the graphic below for a larger overview of the real estate market for the last two weeks in Bridgeland.
Did you know?
If you can't afford to buy a house in Houston, you're part of the majority, report finds.
⁃ Houston Chronicle Article Summary
• According to a report from HAR, nearly 60 percent of Houstonians can't afford to buy a house in the area.
• Prior to the pandemic, approximately 58 percent of households in the region could afford to buy a median-priced house in the second quarter 2019.
• In the second quarter of this year, only about 40 percent could.
• Calculating the monthly payment including standard insurance and taxes for a 30-year, fixed-rated mortgage with a 6.5 percent interest rate, the average buyer could expect to pay about $2,400 for a median-priced home in Houston during Q2 of 2023.
• That is about $170 per month more than one year ago.
• The average household income needed to afford the median-priced home rose about $6,400 from last year to $96,000.
• When compared to other large metros in the state, Houston was still more affordable than Austin or Dallas, which would need an annual income of $136,400 and $107,200, respectively.
• “Rising interest rates continue to weigh on potential homebuyers who are faced with the challenge of balancing affordability and opportunity,” said HAR Chair Cathy Treviño.
The looming crisis that's going to crush homeowners from coast to coast
⁃ Business Insider Article Summary
• California faces the highest wildfire risk among all states, with more than 1.2 million homes at risk of wildfire damage.
• Leading insurers like State Farm, Allstate, American International Group, and Chubb are halting new home insurance policies due to the growing catastrophe exposure and risk in California.
• Florida has a different risk profile, with a third of its population living in flood-prone areas and facing hurricane risks.
• A U.S. Army Corps of Engineers study predicts 3 feet of sea-level rise in Florida, causing an estimated $24 billion in damage annually.
• Home insurance costs in Florida are soaring, with average policies now costing about $4,200, more than double the national average of $1,700.
• More than 13% of homeowners in Florida are uninsured, twice the national average.
• Louisiana, Oregon, and Colorado also experience increased wildfire and flooding risks.
• Hawaii's recent wildfires destroyed over 2,200 structures, and blizzards have doubled in the past two decades.
• Since 2013, winter weather caused $2 billion in property damage, leading to higher insurance rates in affected states.
• Nationwide, average home insurance costs have risen by 21% since 2015 and are expected to increase by 9% this year.
• Climate-related risks are pushing insurers to reevaluate their business in high-risk states, leading to policy changes and higher costs.
• Despite the risks, some residents are committed to staying, even in the face of climate-related challenges.
Jo's Two Cents
What I am seeing…
• Prices have continued to rise.
• New construction has continued to be one of the smartest choices for buyers all around the Houston Suburbs, especially in Montgomery County.
• Large amounts of poorly renovated homes and large amounts of homes that aren’t move in ready, continue to sit on the market.
• Inventory of move in ready homes are sitting at a low. Which we predict will continue for the next 45 days.
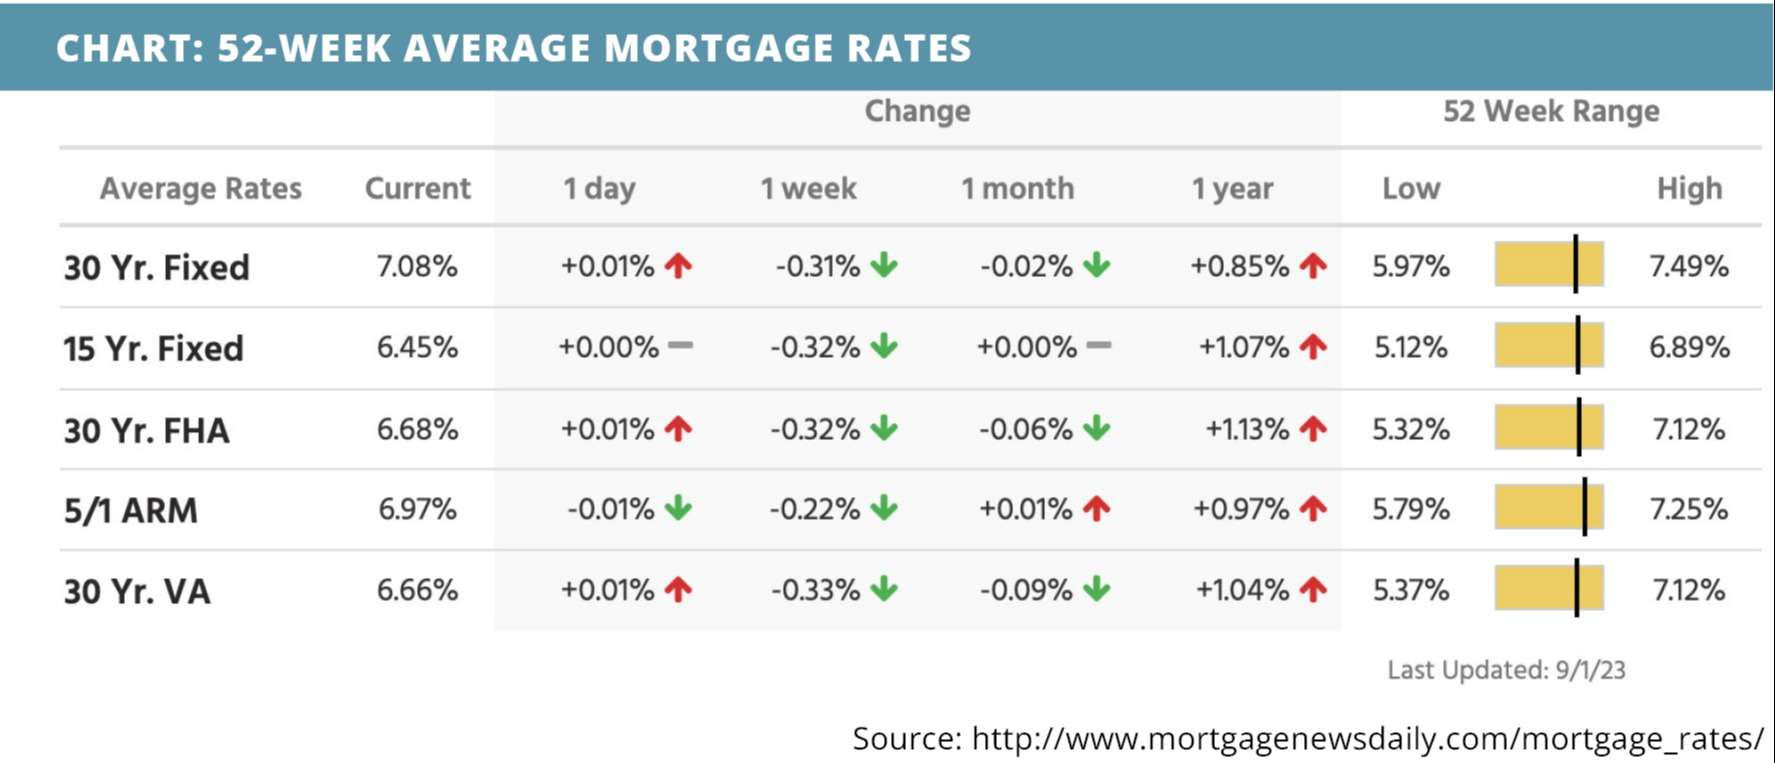
• In the last two weeks, we have seen interest rates break the 7% ceiling, but they are now below it.
• It is still a good time to buy because equity growth is still possible.
What is happening in the real estate market nationally?
Mortgage rates trended lower last week thanks to some downbeat economic data. Home price appreciation continued to slow overall, as did job openings. Mortgage application submissions increased for the first time in over a month. The ADP nonfarm employment change was lower than previous months, as was the GDP estimate for Q2. Continuing jobless claims increased while initial jobless claims decreased. Inflation was as expected, consumer spending was higher, and personal income was lower. The employment situation had mixed results.
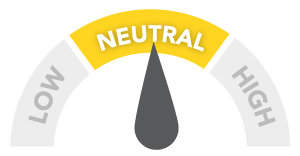
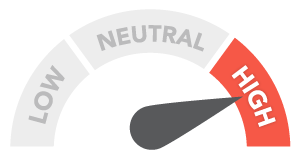
| MORTGAGE RATES CURRENTLY TRENDING | THIS WEEK'S POTENTIAL VOLATILITY |
 |
 |
Notable News
- How the high-rate environment is affecting Reverse Mortgages. Listen Now >>
- Signed contracts for homes rise for the second month in a row. Read Now >>
- Are home prices turning lower? Watch Now >>
Market Recap
-
The FHFA house price index increased 0.3% month-over-month in June – higher than expectations but lower than the previous month. Annually, home prices increased 3.1%, which was higher than the previous month’s annual increase.
-
The 20-city Case-Shiller home price index increased 0.9% month-over-month in June – lower than expectations. Annually, the index saw a smaller-than-expected decrease of 1.2%.
-
Job openings on the Job Openings and Labor Turnover Survey (JOLTS) were at a lower-than-expected level of 8,827,000 in July, possibly signaling a labor slowdown.
-
Mortgage application submissions increased for the first time in several weeks, climbing a composite 2.3% during the week ending 8/25. The Refinance Index increased 3% and the seasonally adjusted Purchase Index increased 2%.
-
The ADP nonfarm employment change in August was at 177,000 – a 200,000 decrease from the month before.
-
GDP for quarter two increased 2.1% vs. the 2.4% expected increase. It did, however, surpass the previous estimate of 2%.
-
Continuing jobless claims saw a larger-than-expected increase during the week ending 8/19, rising by nearly 30,000 to reach a level of 1,725,000. Initial jobless claims inched lower to a level of 228,000 during the week ending 8/26.
-
Inflation on the core PCE index (which strips out food and energy costs) remained at a monthly level of 0.2% in July. Annual core inflation climbed slightly higher to 4.2%, which was as expected. Personal income fell below expectations at 0.2% while consumer spending was slightly higher at 0.8%.
-
The employment situation was a mixed bag in August but ultimately showed hints of weakness. Average hourly earnings fell below expectations at 0.2% month-over-month. The average workweek became slightly longer at 34.4 hours. Government payrolls increased by 8,000, manufacturing payrolls increased by 16,000, and private nonfarm payrolls increased by 179,000 – all higher than expectations. Nonfarm payrolls exceeded expectations as well, rising to 187,000. While the participation rate did increase to 62.8%, it could hint that more people are needing the work, which signals a tighter labor market. The unemployment rate climbed to 3.8% vs. the 3.5% expected.
-
Construction spending climbed 0.7% in July, surpassing the expectations and the previous month’s level.
Review of Last Week
NOT TOO BAD, NOT TOO GOOD… Traders sent stocks up for the week on a batch of mildly up and mildly down economic data that made them feel the Fed would keep interest rates on pause and the economy might see a soft landing.
The August jobs report showed a cooling labor market, with a net gain of only 77,000 nonfarm payrolls after the prior two months' increases were revised down. Q2 GDP slipped to 2.0% and manufacturing is still contracting.
But economic strength was shown in continued low initial unemployment claims, and healthy gains in consumer income and spending. PCE inflation saw a year-over-year uptick, but it was small enough to not be worrisome.
The week ended with the Dow UP 1.4%, to 34,838; the S&P 500 UP 2.5%, to 4,516; and the Nasdaq UP 3.2%, to 14,032.
Overall, bonds finished ahead, the 30-Year UMBS 6.0% UP 0.94, to $100.09. The national average 30-year fixed mortgage rate reversed course, heading down in Freddie Mac's Primary Mortgage Market Survey. Remember, mortgage rates can be extremely volatile, so check with your mortgage professional for up-to-the-minute information.
DID YOU KNOW… Based on data from the Census Bureau and HUD, the fall has seen higher home prices and less time on market for new homes than the rest of the year, and 2023 sales so far have outpaced 2022 levels.
Market Forecast
SERVICES SECTOR, UNIT LABOR COSTS, FED BEIGE BOOK… The all-important services sector of the economy is expected down but still showing expansion, according to the ISM Non-Manufacturing Index. The Revised read on Unit Labor Costs for Q2 should still report a gain, which is not good, since higher labor costs are a leading indicator for higher inflation. We’ll also check out the Fed’s Beige Book for a look at the economy across the U.S.
All U.S. financial markets were closed yesterday, September 4, in observance of Labor Day.
Summary
Confounding all forecasts, Pending Home Sales rose in July at the fastest pace since January. The National Association of Realtors noted, “Jobs are being added and, thereby, enlarging the pool of prospective home buyers.”
The S&P CoreLogic Case-Shiller index reported a 0.7% increase in home prices in June, bringing them back to where they were a year ago. The FHFA index posted a 0.3% gain for the month, 3.0% ahead of last year.
Residential Construction Spending continued to march forward in July, 1.4% over June. It’s still a bit behind where it was a year ago, but this July’s gain was powered by spending on much-needed single-family homes.
Can we sell yours?
So if you are in need of a listing agent, we would love the opportunity to see your home and meet you of course. My husband, Edward, and I, look forward to being the brokerage and team for you! You can reach out to us via email: [email protected] & [email protected] or telephone: 832-493-6685.
Read more:
If you are curious ‘How to get more money for your home when listing it for sale', check out this blog post.
I hope you have found this blog post super helpful. If there is anything else we can do for you, including helping you sell (or buy) a home, I would be honored to assist. I hope you have a great day/evening. Cheers, E + J.
We are so happy you found our little corner of the interwebs. We look forward to y'all reaching out to us. We love to answer questions and welcome them. Recently we created some local maps, and you can download those by clicking the image/link above. Below, you will find an index of some very helpful information to assist you in learning more about the Houston suburbs. If you are relocating to our neck of the woods, we hope you reach out to us, because we would love to help you by being your local realtor and friend. Thoughtfully written for you. Hugs, Jo.
We are Waiting for You
If you are looking to relocate to the Houston Area, we would love to meet you, and hear your story. Below you will find all of my contact information, as well as some homes for sale in the area. We truly look forward to hearing from you! P.S. Don't forget to check out our YouTube Channel!
If you are overwhelmed..
Now if you are feeling overwhelmed on where you should plant your roots, I would love to talk to you. You can schedule a call with me by click this link: http://byjoandco.com/call or just send us an email: [email protected]. There are some amazing communities all over the Houston suburbs. In this post, https://search.byjoandco.com/blog/best-neighborhoods-in-houston/, I deep dive into all the different suburbs/neighborhoods that you might want to consider, and why. There are many resources here, so please reach out if you are curious what to look at next! Thank you for trusting us.
What next?!
• Navigate our Blog: https://byjoandco.com/categories-to-help-you-navigate-the-blog/
• Download our Moving to Texas ebook! http://byjoandco.com/movingtotexasebook.
• Download our Where to Live in Houston Texas ebook! http://byjoandco.com/wheretoliveebook.
• Browse our Ebooks and Relocation Guides: http://byjoandco.com/ebooks
• Schedule a phone call or appointment with us! http://byjoandco.com/appointment.
• Email us! [email protected].
• Looking for a buyer’s agent? Fill out our buyer questionnaire! http://byjoandco.com/q.
• Ready to find your dream home? Search, http://search.byjoandco.com.
• Subscribe to our YouTube Channel: http://byjoandco.com/youtube.


