Hi neighbor,
Today I will be sharing with you our perspective on the local real estate market here in The Woodlands, Texas, specifically a market update for the neighborhood of 77382. Whether you are looking to buy, sell, or just keep an eye on the market, we look forward to being your resource.
What is happening in the real estate market in 77382?
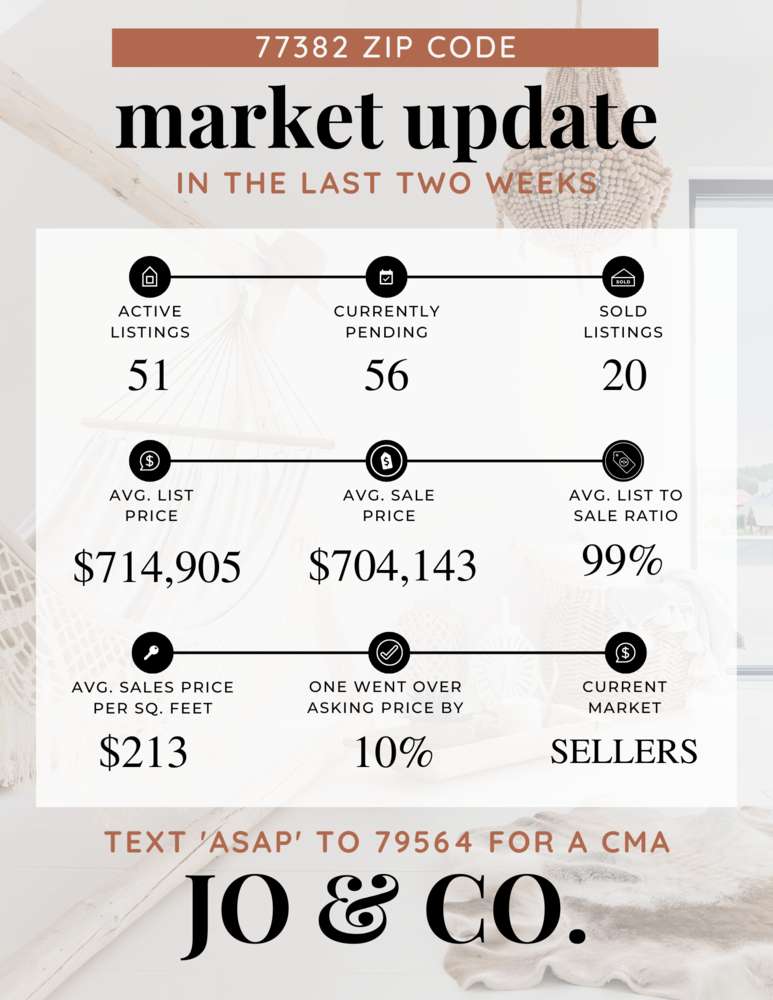
We currently have 56 homes pending, with 20 homes sold in the last two weeks, averaging a sale price of $213 a square foot. Twenty homes sold over the asking price, with one home selling 10% above the listing price.
Compared to the two weeks prior: Homes sold are slightly down from 30 sold, and the average sales price is down as well. This is most likely a coincidence, so we will be sure to keep an eye on it over the next couple of weeks. Every home is different, with different features, so don’t forget to ask us for your annual equity review if you are curious about your personal home. You can text AER to 79564 or email us here.
If we look at how fast the move-in-ready homes are going, the demand in this area has not surpassed the supply, making it still a great time to sell. Buyer agents around Houston are seeing a slow in the real estate market, but it isn’t affecting the neighborhoods. I know the interest rates rising has been one deterrent from some buyers purchasing right now, but that isn’t your ideal buyer anyways!
The most desirable homes in the area are still selling the first weekend or first week they hit the market (a really good coming soon campaign, like we do at Jo & Co. allows you to sell faster, for more money).
Check out the graphic below for a larger overview of the real estate market for the last two weeks in 77382.
Jo's Two Cents
I know this isn't new news, but the lack of active listings continues to weigh on existing home sales, while new construction inventory is up, which has the potential to meet some of the home demand. New construction isn't for everyone with its very apparent pros and cons, but I think all buyers should consider new construction this summer. Just in case you are curious, I wanted to chime in on the pros and cons from my perspective: Pros of new construction: – Built-in and extended warranties at no extra cost – Most builders are offering large incentives – Many options at all price points – Options in almost every city – Huge price cuts due to inventory high – Builders are typically willing to pay down interest rates – Low cost of maintenance – Brand new amenities Cons of new construction: – Typically a higher tax rate – Some new construction neighborhoods don't have their amenities built out yet – The schools might not be as highly-rated as the established areas – Typically on the edge of town If you are considering new construction, I would love to be your realtor. Duh, I know. Lol. This week's real estate facts and statistics:
- Nationally, existing home sales have dropped 20% in comparison to last year.
- According to the National Association of Realtors, existing home sales had their largest price decrease in 11 years. And this might have a correlation with the fact that many of the homes going under contract have longer days on the market because they are less desirable, driving the cost down.
- Total housing inventory was down last month by 6.1% compared to the same period in the previous year.
- New home sales jumped 20% in May, a 12.2% jump from April.
- New home inventory was 31% of the total inventory in May. Historically it is typically 10% to 15%.”
- The median sale price of new homes sold in May was $416,300 — down from the May 2022 median price of $449,000. The average sale price was $487,300, a decrease from the May 2022 average of $511,400. Locally we aren't seeing this in the neighborhoods with high demand and low inventory.
What is happening in the real estate market nationally?
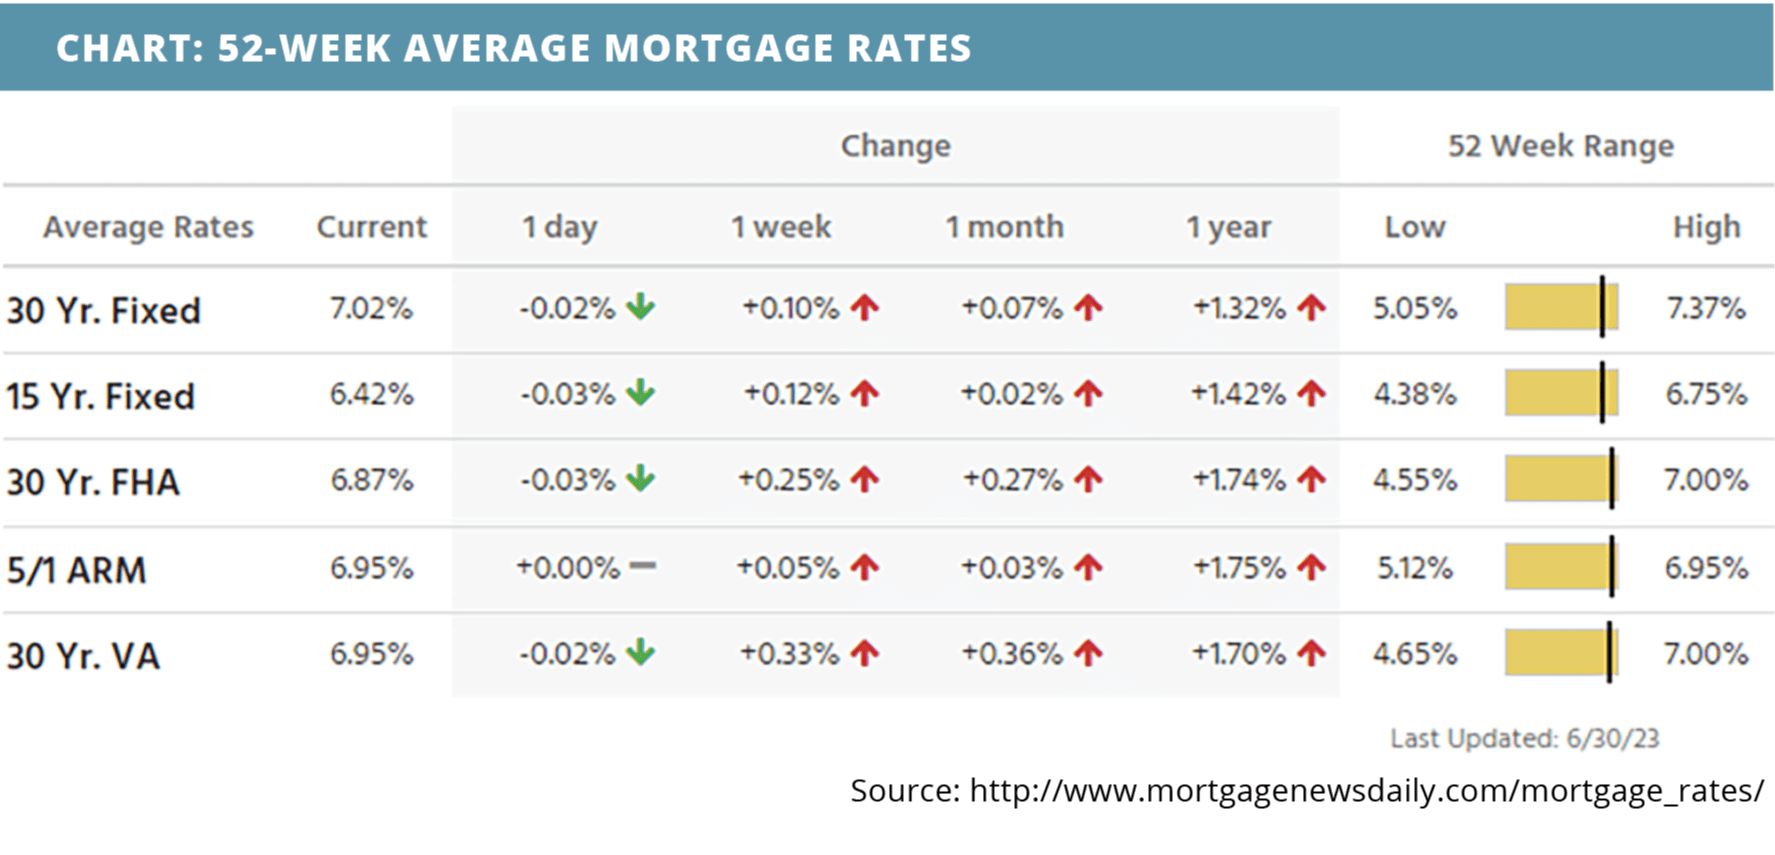
Mortgage rates trended higher last week following the release of data that suggested economic resilience. Home price indices revealed conflicting data. New home sales soared in May, mortgage application submissions increased two weeks ago, jobless claims fell, and the Q1 GDP estimate decreased. Pending home sales fell in May, and core inflation was largely as expected.
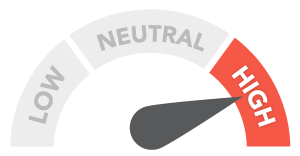
| MORTGAGE RATES CURRENTLY TRENDING | THIS WEEK'S POTENTIAL VOLATILITY |
 |
 |
Notable News
- Interest rates matter less today than they have historically. Watch Now >>
- Home buyers have adjusted to the new normal of rates. Read Now >>
- Contract signings are low, but buyer demand is still high. Read Now >>
Market Recap
-
The FHFA house price index jumped 0.7% month-over-month in April – higher than expected. Annually, the index was right on the mark at 3.1%. The monthly climb could be attributed to typical increases during peak home buying season.
-
Monthly increases on the 20-city Case-Shiller home price index were higher than expected as well, rising 0.9% vs the 0.5% expected. Annually, the index fell 1.7%. Despite monthly gains, prices are still lower than their mid-2022 peak, offering slight hope for buyers.
-
New home sales surged 12.2% month-over-month in May, climbing to a seasonally adjusted annual rate of 763,000 – about 100,000 higher than the predicted number of sales. This brings the number of new sales to the highest level in nearly 1 ½ years. Home builders are making the extra push to provide consumers more options in the low inventory environment.
-
Mortgage application submissions increased a composite 3% during the week 6/21. Both the Refinance Index and the Purchase Index increased 3%. Purchase applications increased for the third consecutive week to the highest level since early May, largely due to new home sales.
-
Continuing jobless claims were at 1,742,000 during the week ending 6/17, a 20,000 drop from the week before. Initial jobless claims fell as well, dropping from 265,000 to 239,000 during the week ending 6/24.
-
GDP estimate for quarter one was at 2%, lower than the previous month, but higher than expectations. The Fed’s rising rates continue to restrict the economy.
-
Pending home sales saw a larger-then-expected decline in May, falling by 2.7%, largely due to the tight housing supply.
-
The core personal consumption expenditures (PCE) index, measuring inflation without food and energy costs, rose 0.3% month-over-month in May as expected. Annual inflation on the index was slightly below expectations at 4.6%. This index is the Fed’s preferred method of measuring inflation, and it’s good that it fell inline/slightly below expectations. Personal income increased 0.4%, which was higher than the 0.3% expected. Consumer spending, however, was below expectations at just 0.1%, which could be a good sign that spending and inflation is continuing to cool.
Review of Last Week
AHEAD AT THE HALF… The three major stock indexes finished the week, the month, and the first half of the year solidly ahead. Traders were feeling the economy can avoid a recession and the Fed is close to done hiking rates.
However, all was not perfect. Consumer spending rose in May a way-less-than-expected 0.1% and Core PCE Prices, the Fed's favorite inflation measure, moderated, but by a mere 0.1% year-over-year.
But a pile of data beat forecasts—Personal Income, Durable Goods Orders, New Home Sales, Consumer Confidence, and weekly Initial Jobless Claims. Plus, Q1 GDP was upwardly revised to report 2.0% economic growth.
The week ended with the Dow UP 2.0%, to 34,408; the S&P 500 UP 2.3%, to 4,450; and the Nasdaq UP 2.2%, to 13,788.
With so much money flowing into equities, bonds finished a bit down overall, the 30-Year UMBS 5.5% slipping 0.52, to $99.39. In Freddie Mac's Primary Mortgage Market Survey, the national average 30-year fixed mortgage rate edged up modestly. Remember, mortgage rates can be extremely volatile, so check with your mortgage professional for up-to-the-minute information.
DID YOU KNOW… The Mortgage Bankers Association reported for the week ending June 23, applications for purchase mortgages rose “for the third consecutive week, to the highest level of activity since early May.”
Market Forecast
CONSTRUCTION SPENDING, MANUFACTURING, SERVICES, JOBS… May should see a small gain in overall Construction Spending, but we'll focus on the residential part. The June ISM Manufacturing Index is expected to have that sector of the economy still contracting, while the ISM Non-Manufacturing Index shows the dominant services sector barely expanding. About 200,000 new Nonfarm Payrolls are forecast for June, with the Unemployment Rate holding around 3.7%.
In observance of Independence Day, U.S. financial markets will close early today, and will remain closed tomorrow, July 4.
Summary
Sales of new single-family homes rocketed ahead 12.2% in May, up for the third straight month. Reasons? The supply of completed homes has more than doubled since the bottom, and the median sale price is 7.6% below a year ago.
Existing home supply remains tight, so the index of signed contracts on those homes dipped in May. But demand is strong, the National Association of Realtors reporting “approximately three offers for each listing.”
The national Case-Shiller home price index moved up in April for the third straight month, though it’s still down a tad annually. The FHFA Index of prices for homes bought with conforming mortgages rose to a new all-time high.
Can we sell yours?
So if you are in need of a listing agent, we would love the opportunity to see your home and meet you of course. My husband, Edward, and I, look forward to being the brokerage and team for you! You can reach out to us via email: [email protected] & [email protected] or telephone: 832-493-6685.
Read more:
If you are curious ‘How to get more money for your home when listing it for sale', check out this blog post.
I hope you have found this blog post super helpful. If there is anything else we can do for you, including helping you sell (or buy) a home, I would be honored to assist. I hope you have a great day/evening. Cheers, E + J.
We are so happy you found our little corner of the interwebs. We look forward to y'all reaching out to us. We love to answer questions and welcome them. Recently we created some local maps, and you can download those by clicking the image/link above. Below, you will find an index of some very helpful information to assist you in learning more about the Houston suburbs. If you are relocating to our neck of the woods, we hope you reach out to us, because we would love to help you by being your local realtor and friend. Thoughtfully written for you. Hugs, Jo.
We are Waiting for You
If you are looking to relocate to the Houston Area, we would love to meet you, and hear your story. Below you will find all of my contact information, as well as some homes for sale in the area. We truly look forward to hearing from you! P.S. Don't forget to check out our YouTube Channel!
If you are overwhelmed..
Now if you are feeling overwhelmed on where you should plant your roots, I would love to talk to you. You can schedule a call with me by click this link: http://byjoandco.com/call or just send us an email: [email protected]. There are some amazing communities all over the Houston suburbs. In this post, https://search.byjoandco.com/blog/best-neighborhoods-in-houston/, I deep dive into all the different suburbs/neighborhoods that you might want to consider, and why. There are many resources here, so please reach out if you are curious what to look at next! Thank you for trusting us.
What next?!
• Navigate our Blog: https://byjoandco.com/categories-to-help-you-navigate-the-blog/
• Download our Moving to Texas ebook! http://byjoandco.com/movingtotexasebook.
• Download our Where to Live in Houston Texas ebook! http://byjoandco.com/wheretoliveebook.
• Browse our Ebooks and Relocation Guides: http://byjoandco.com/ebooks
• Schedule a phone call or appointment with us! http://byjoandco.com/appointment.
• Email us! [email protected].
• Looking for a buyer’s agent? Fill out our buyer questionnaire! http://byjoandco.com/q.
• Ready to find your dream home? Search, http://search.byjoandco.com.
• Subscribe to our YouTube Channel: http://byjoandco.com/youtube.


