Hi neighbor,
Today I will be sharing with you our perspective on the local real estate market here in Spring, Texas, specifically a market update for the neighborhood of Terranova West. Whether you are looking to buy, sell, or just keep an eye on the market, we look forward to being your resource.
What is happening in the real estate market in Terranova West?
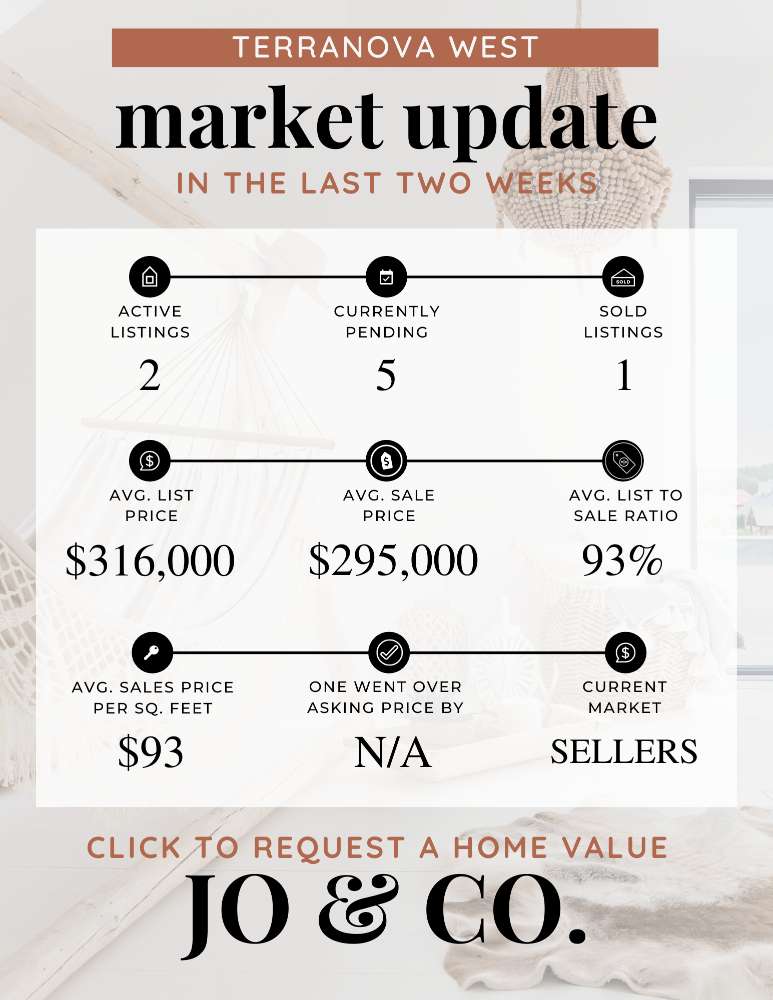
We currently have 5 homes pending, with 1 home sold in the last two weeks, averaging a sale price of $93 a square foot. One home sold over the asking price.
Compared to the two weeks prior, we haven’t seen big changes in the market. The average sales price in the neighborhood is $295,000. Every home is different, with different features, so don’t forget to ask us for your annual equity review if you are curious about your personal home. You can request your free home evaluation here or email us here.
I know the interest rates rising has been one deterrent from some buyers purchasing right now, but that isn’t your ideal buyer anyways! And the educated buyer still knows, they need to buy ASAP. The most desirable homes in the area are still selling the first weekend or first week they hit the market (a really good coming soon campaign, like we do at Jo & Co. allows you to sell faster, for more money).
Check out the graphic below for a larger overview of the real estate market for the last two weeks in Terranova West.
What I have gathered…
Dual Inflation Rates
Last week, the Consumer Price Index (CPI) for August saw a 0.6% monthly increase, pushing the annual rate to 3.7%—both figures exceeding predictions. The monthly jump was the most significant for the year, largely fueled by rising energy costs. Oil prices jumped almost 11% during August, as the cost per barrel rose from $65 to $89 between June and September.
On the other hand, the Core CPI—which omits food and energy costs and is more keenly observed by the Federal Reserve—fell from 4.7% to 4.3% year-over-year, showing signs of moving in a favorable direction.
Following the release of this news, the 10-year Treasury Note yield retreated from 4.35% to 4.25%, indicating that the bond market and interest rates found the Core CPI decline encouraging.
Peaks in 2023 Oil Prices
As stated, the primary driver for August's inflation uptick was the surge in oil prices, which have continued to climb, reaching new highs for 2023 last week. If this trend persists, we can anticipate that the CPI for September will also reflect elevated headline inflation, confirming that inflation reached its nadir in June.
The Silent Phase Persists
As the Federal Reserve's upcoming meeting looms, its officials are refraining from public comments on monetary policy. This period of quietude has helped to stabilize interest rate fluctuations and maintain rates below 2023 highs. Expect changes in the week ahead.
Presently, Fed Fund Futures, which gauge the likelihood of interest rate adjustments, predict an almost certain chance of no rate hike during this meeting.
Rising Rates in Japan
Global interest rates have been ticking upward, and Japan has followed suit. With inflation hitting four-decade highs in the country, Japan's Central Bank has permitted their 10-year government bond yield to reach 0.7%, the highest since 2014. If this trend continues, it could exert upward pressure on worldwide yields, including the U.S. 10-year Note.
The Bottom Line
Interest rates are near their yearly highs, and there's a potential for accelerating headline inflation, particularly due to energy costs. Monitoring this will be crucial in the coming months, as any uptick in inflation could compel the Fed to further raise rates.
Looking Ahead
This Wednesday, the Federal Reserve will disclose its Monetary Policy Statement and interest rate decisions. Prior to the silent phase, several Fed members emphasized the need for “patience” and a likely “pause” in further hikes, pending economic developments. Market sentiment suggests no rate hike this week and a 50/50 likelihood of one in November.
Mortgage Market Outlook
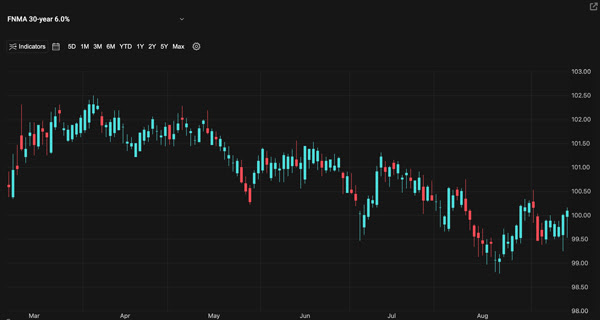
Mortgage bond prices set the stage for home loan rates. The accompanying one-year chart showcases the Fannie Mae 30-year 6.0% coupon, which serves as the basis for currently closed loans. Rising prices correlate with lower rates and vice versa.
The chart indicates attempts to stabilize above the lowest prices of 2023, which could lead to additional improvement in rates if sustained. Nevertheless, if bond prices dip below $99, we may see another uptick in home loan rates.
Chart: Fannie Mae 30-Year 6.0% Coupon (Friday, September 15, 2023)
What is happening in the real estate market nationally?
Last week, mortgage rates trended higher due to weakness in the underlying bond market. Home prices increased on the FHFA house price index but were relatively unchanged on the Case-Shiller home price index in July. New home sales slipped in August. Mortgage application submissions also decreased. Continuing and initial jobless claims also climbed higher. The Q2 GDP estimate was unchanged. Pending home sales decreased in August. The core PCE index showed good signs for the markets, consumer spending was lower than the month before, but personal income increased.
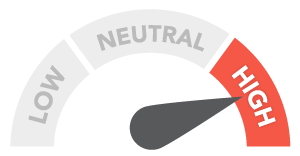
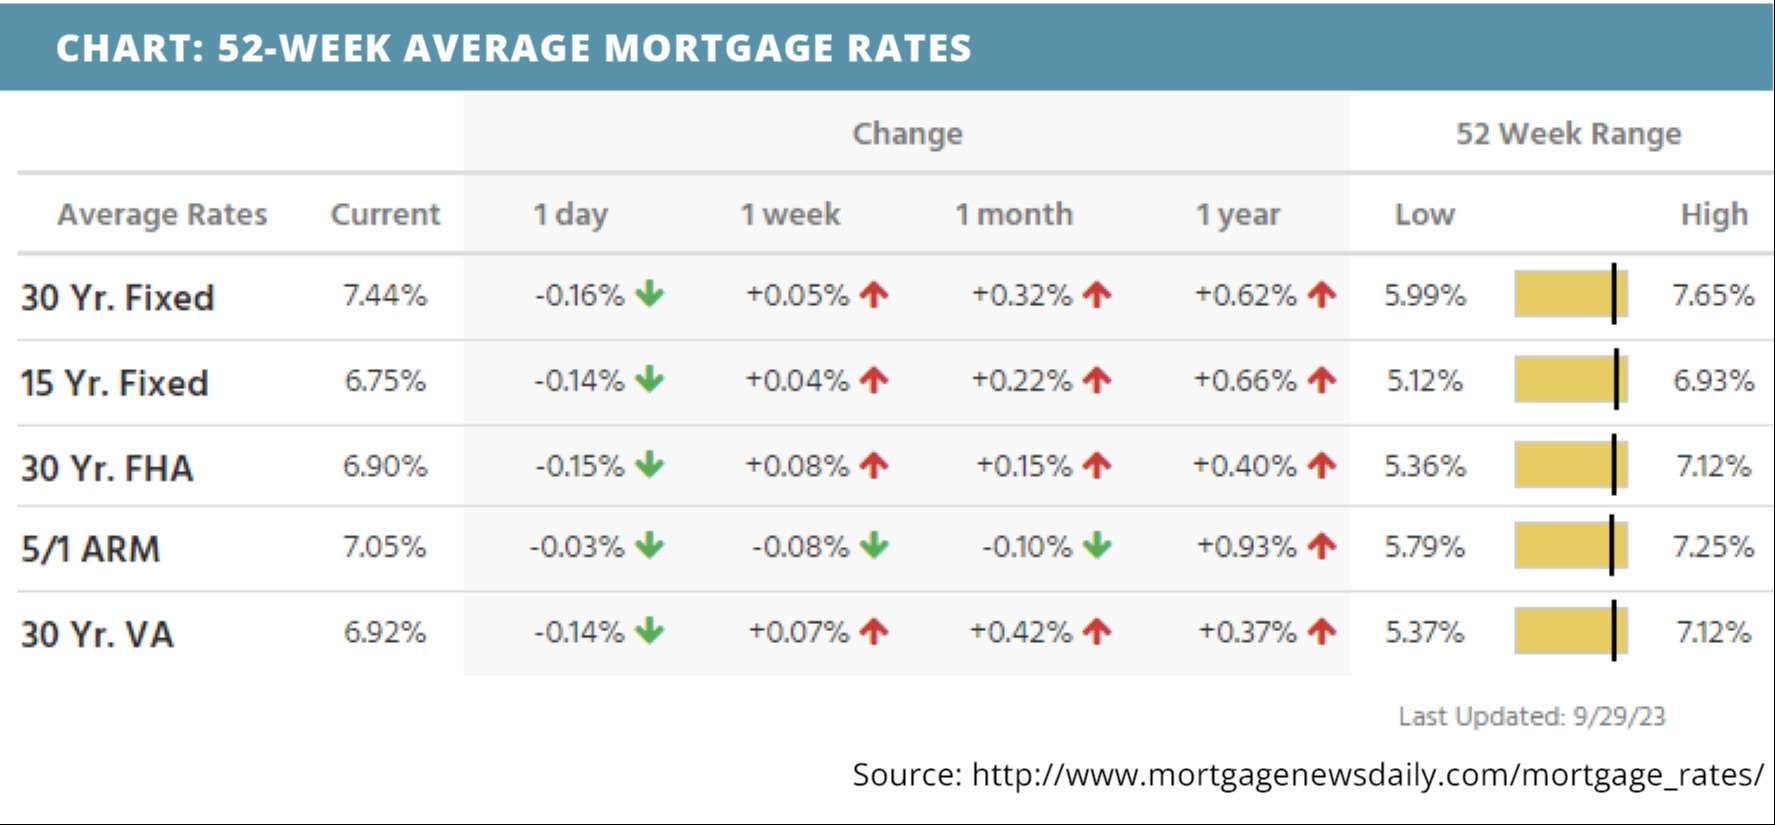
| MORTGAGE RATES CURRENTLY TRENDING | THIS WEEK'S POTENTIAL VOLATILITY |
 |
 |
Notable News
- Despite rising home prices and rates, home buyers are looking to relocate. Read Now >>
- Here are the lottery winners of the current housing market. Read Now >>
- HousingWire Managing Editor Speaks on the highest mortgage rates in over two decades. Listen Now >>
Market Recap
-
Home prices on the FHFA house price index increased 0.8% month-over-month in July, double their pace in June. Annually, the index increased as well, up to 4.6% vs. 3.2% the month before.
-
Home prices on the 20-city Case-Shiller home price index held steady at 0.9% in July. Annually, home prices were only 0.1% higher than they were last year.
-
New home sales were at a seasonally adjusted annual rate of 675,000, an 8.7% decrease in August.
-
Mortgage applications submissions decreased a composite 1.3% during the week ending 9/22. Refinance application submissions fell 1%, while seasonally adjusted purchase applications fell 2%.
-
Continuing jobless claims were at 1,670,000 during the week ending 9/16, a 12,000 increase from the week before. Initial jobless claims were at 204,000 during the week ending 9/23, a 2,000 increase.
-
The Q2 GDP estimate held steady at 2.1%.
-
Pending home sales decreased 7.1% in August. They were expected to decline by just 0.8%.
-
The core personal consumption expenditures (PCE) index, the Fed’s preferred method of measuring inflation, fell below expectations in August at just 0.1% month-over-month. Annual inflation on the core PCE index also fell below expectations at just 3.9%. The last time the core PCE index was this low was two years ago. Personal income, on the other hand, increased 0.4% month-over-month in August, which was right in line with expectations. Consumer spending was also in line with expectations at 0.4%, which was a noticeable decline from the month before.
Review of Last Week
SEPTEMBER SWOON… September upheld its reputation as the worst month of the year for the S&P 500, which ended down for the week along with the Dow, while the tech-y Nasdaq barely managed a gain.
Economic signals were mixed. Consumer Confidence hit a four-month low in September, and crude oil futures rose to more than $90 a barrel, sparking concerns over inflation, gas prices, and a slowdown in consumer spending.
Yet consumer income and spending rose in August, while Core PCE Prices posted a cooler than expected inflation read, though at 3.9%, it still wasn’t weak enough for the Fed to cut rates any time soon.
The week ended with the Dow down 1.3%, to 33,508; the S&P 500 down 0.7%, to 4,288; and the Nasdaq UP 0.1%, to 13,219.
The bond market also headed south, the 30-Year UMBS 6.0% dropping 0.78, to $98.24. Freddie Mac's Primary Mortgage Market Survey reported the national average 30-year fixed mortgage rate rose by a few basis points. Remember, mortgage rates can be extremely volatile, so check with your mortgage professional for up-to-the-minute information.
DID YOU KNOW… Mortgage applications for new homes rose 3.7% in August, so new home sales should rebound in September. These applications were 20.6% higher than a year ago, as demand for new homes picks up.
Market Forecast
CONSTRUCTION SPENDING, MANUFACTURING, SERVICES, JOBS… August Construction Spending should continue to head up overall, but we'll monitor the residential part. The ISM Manufacturing Index is forecast to still have that sector of the economy contracting, but ISM Non-Manufacturing is expected to show the far larger services sector in expansion territory. Analysts predict fewer Nonfarm Payrolls added in September, with the Unemployment Rate a low 3.7%.
Summary
Sales of new single-family homes dipped 8.7% in August, yet they’re still 5.8% ahead of where they were a year ago. Good news for buyers, the median sales price of new homes is down 13.4% from its peak late last year.
The August Pending Home Sales index of signed contracts on existing homes slipped 7.1% from July. The National Association of Realtors noted, “Some would-be home buyers are taking a pause and readjusting their expectations.”
The national Case-Shiller Home Price Index accelerated in July after stagnating in June, and has now reached a new all-time high. The lack of supply amidst stable demand has continued to put upward pressure on prices.
Can we sell yours?
So if you are in need of a listing agent, we would love the opportunity to see your home and meet you of course. My husband, Edward, and I, look forward to being the brokerage and team for you! You can reach out to us via email: [email protected] & [email protected] or telephone: 832-493-6685.
Read more:
If you are curious ‘How to get more money for your home when listing it for sale', check out this blog post.
I hope you have found this blog post super helpful. If there is anything else we can do for you, including helping you sell (or buy) a home, I would be honored to assist. I hope you have a great day/evening. Cheers, E + J.
We are so happy you found our little corner of the interwebs. We look forward to y'all reaching out to us. We love to answer questions and welcome them. Recently we created some local maps, and you can download those by clicking the image/link above. Below, you will find an index of some very helpful information to assist you in learning more about the Houston suburbs. If you are relocating to our neck of the woods, we hope you reach out to us, because we would love to help you by being your local realtor and friend. Thoughtfully written for you. Hugs, Jo.
We are Waiting for You
If you are looking to relocate to the Houston Area, we would love to meet you, and hear your story. Below you will find all of my contact information, as well as some homes for sale in the area. We truly look forward to hearing from you! P.S. Don't forget to check out our YouTube Channel!
If you are overwhelmed..
Now if you are feeling overwhelmed on where you should plant your roots, I would love to talk to you. You can schedule a call with me by click this link: http://byjoandco.com/call or just send us an email: [email protected]. There are some amazing communities all over the Houston suburbs. In this post, https://search.byjoandco.com/blog/best-neighborhoods-in-houston/, I deep dive into all the different suburbs/neighborhoods that you might want to consider, and why. There are many resources here, so please reach out if you are curious what to look at next! Thank you for trusting us.
What next?!
• Navigate our Blog: https://byjoandco.com/categories-to-help-you-navigate-the-blog/
• Download our Moving to Texas ebook! http://byjoandco.com/movingtotexasebook.
• Download our Where to Live in Houston Texas ebook! http://byjoandco.com/wheretoliveebook.
• Browse our Ebooks and Relocation Guides: http://byjoandco.com/ebooks
• Schedule a phone call or appointment with us! http://byjoandco.com/appointment.
• Email us! [email protected].
• Looking for a buyer’s agent? Fill out our buyer questionnaire! http://byjoandco.com/q.
• Ready to find your dream home? Search, http://search.byjoandco.com.
• Subscribe to our YouTube Channel: http://byjoandco.com/youtube.


